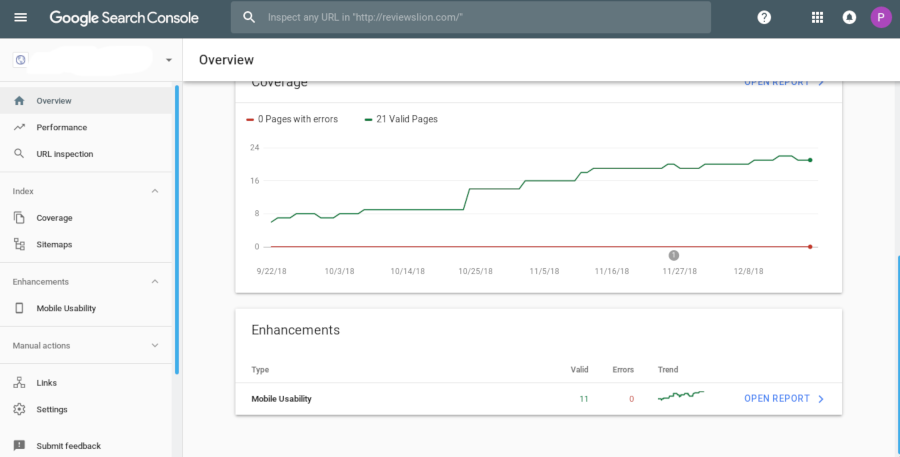
Google has retired the old Google Search Console/Webmaster Tools. The search engine giant is not allowing users to see the old reports. When users log in to their search console account, they are now seeing the new and polished Search Console interface instead of a list of sites.
What features does the new GSC provide to the users? Is it better than Webmaster Tools? Here’s my honest review of the new GSC:
As mentioned earlier, you won’t see a list of verified websites in the new Search Console. The interface loads the report of the site you were last working on.
The interface of the new version of GSC is better compared to the old GSC. Unlike the older tool, GSC now features a search box that allows you to quickly open the dashboard of a site you’ve verified with the GSC.

GSC’s main interface is divided into two sections. On the left-hand side, you’ll see a menu bar that flaunts the names of reports GSC gives access to the users. On the right-hand side, you’ll find the report. Users can hide/unhide the menubar.
The menu bar has the following entries:
- Overview.
- Performance.
- URL Inspection.
- Coverage.
- Sitemaps.
- Mobile Usability.
- Settings.
- Submit feedback.
- About new version.
- Go to the old version.
Overview: The overview section displays a summary of the other reports.
Performance report: Want to know how your site performed in the search results? Which are the top-ranking pages? Which posts need optimization? Open the performance report of the Google Search Console.
The GWT displayed data of up to 3 months. There’s no date range limit in the new GSC tool. Also, GSC now enables you to filter data by words and numbers. Thus, you don’t have to export GSC data and analyze it with Microsoft Excel and similar applications.
Coverage Report: This is the most important report in the new Google Search Console. When a user submits a sitemap, Googlebot will index only the pages which it feels it should be in the Google index.
The Coverage report displays a bar graph of the errors, impressions, and clicks the pages have received. It displays the number of valid pages and a count of pages that have been crawled but not indexed.
Unlike the old GSC index report, the Coverage Report displays the date on which the report was updated. It also displays a few reasons why some pages of your website were not included in the search index.
GSC groups the links into the following categories:
- Crawled – Currently no indexed.
- Excluded by no index tag.
- Blocked by robots.txt.
- Soft 404.
- Page with a redirect.
- Discovered currently not indexed.
- Crawl Anomaly.
- Canonical link issue.
- Not found 404.
When you fix the error, you can make Googlebot reprocess the pages with issues by clicking the Validate button.
Mobile Usability: This report will make you aware of the pages that are not mobile friendly. It displays the number of valid and invalid mobile-friendly URLs.
Links: This section of GSC makes you aware of the internal links structure, and the links that are pointing to your domain (backlinks). It also displays the anchor text used for the internal links.
AMP Reports: Google had introduced AMP in 2017. AMP is nothing but Google’s CDN service which serves pages of various websites from its own domain. If you have implemented it on your website, you can check the index status of the AMP pages on your website through this report.
Final thoughts: The new Google search console provides new features. It also has a better interface compared to the older version. It makes the lives of webmasters easier by providing new filters and reports. Most importantly, the new GSC saves money as you don’t have to hire an SEO agency or firm to audit your site.


